Problem Statement
Text-To-Speech (TTS) systems of Skit, as well as TTS systems in general, have a tendency to mix some ambient noise along with the speech it outputs. This aim of this research project was to remove that noise and quantify how well the noise has been removed using standard metrics.
Listen to the clean speech sample here for reference-
and the distorted sample-
Introduction
Speech enhancement can be done using the traditional signal processing techniques or using deep learning techniques. In this project, we mainly focused on the signal processing aspects of noise reduction. Signal processing techniques can be further divided into 3 more categories-
Spectral Subtractive algorithms
The main principle is as follows- assuming additive noise, one can obtain an estimate of the clean signal spectrum by subtracting an estimate of the noise spectrum from the noisy speech spectrum. The noise spectrum can be estimated and updated, during periods when the signal is absent. The assumption made is that noise is stationary or a slowly varying process and that the noise spectrum does not change significantly between the updating periods. The enhanced signal is obtained by computing the IDFT of the estimated signal spectrum using the phase of the noisy signal.
Statistical Model based algorithms
Given a set of measurements that depend on an unknown parameter, we wish to find a nonlinear estimator of the parameter of interest. These measurements correspond to the set of DFT coefficients of the noisy signal and the parameters of interest are the set of DFT coefficients of the clean signal. Various techniques from estimation theory which include maximum-likelihood (ML) estimators and the Bayesian estimators like MMSE and MAP estimators are used for this purpose.
Subspace algorithms
These algorithms are based on the principle that the clean signal might be confined to a subspace of the noisy Euclidean space. Given a method for decomposing the vector space of the noisy signal into a direct sum of the subspace that is occupied by the clean signal and a subspace occupied by the noise signal, for example SVD, we could estimate the clean signal simply by nulling the component of the noisy vector residing in the noisy subspace.
Contributions
Filters
Speech enhancement can be done using the traditional signal processing techniques or using deep learning techniques. We hypothesised that signal processing techniques would be suitable for task and tested them out. We implemented some of the popular speech enhancement methods which were suitably modified to tackle the problem at hand.
Wiener Filter

The input signal w[n] goes through a linear and time-invariant system to produce an output signal x[n]. We are to design the system in such a way that the output signal, x[n], is as close to the desired signal, s[n], as possible. This can be done by computing the estimation error, e[n], and making it as small as possible. The optimal filter that minimizes the estimation error is called the Wiener filter.
MMSE and MMSE Log Filter
These fall under the umbrella of Bayesian estimation techniques. We saw above that the Wiener estimator can be derived by minimizing the error between a linear model of the clean spectrum and the true spectrum. The Wiener estimator is considered to be the optimal (in the mean-square-error sense) complex spectral estimator, but is not the optimal spectral magnitude estimator. Acknowledging the importance of the short-time spectral amplitude (STSA) on speech intelligibility and quality, several authors have proposed optimal methods for obtaining the spectral amplitudes from noisy observations. In particular, we are looking for sought that minimized the mean-square error between the estimated and true magnitudes:
\[e = E{ (\hat{X_k} - X_k)^2 }\]where \(\hat{X_k}\) is the estimate spectral magnitude at frequency \(\omega_k\) and \(X_k\) is the true magnitude of the clean signal.
The MMSE Log is an improvement upon the MMSE estimator. Although a metric based on the squared error of the magnitude spectra is mathematically tractable, it may not be subjectively meaningful. It has been suggested that a metric based on the squared error of the log-magnitude spectra may be more suitable for speech processing. So we minimize :
\[e = E \{ (log \hat X_k - log X_k)^2 \}\]and we notice a significant improvement in the results compared to the original MMSE estimator.
Berouti’s Oversubstraction
This method consists of subtracting an overestimate of the noise power spectrum, while preventing the resultant spectral components from going below a preset minimum value (spectral floor).
\[\hat X(\omega)=\begin{cases} |Y(\omega)|^2 - \alpha |\hat D(\omega)|^2& \text{if } |Y(\omega)|^2 \geq (\alpha + \beta) |D(\omega)|^2 \\ \beta |\hat D(\omega)|^2 & \text{else} \end{cases}\]where \(\alpha (\geq 1)\) is the oversubtraction factor and \(0 \leq \beta \leq 1\) is the spectral floor parameter.
When we subtract the estimate of the noise spectrum from the noisy speech spectrum, there remain peaks in the spectrum. Some of those peaks are broadband (encompassing a wide range of frequencies) whereas others are narrow band, appearing as spikes in the spectrum. By oversubtracting the noise spectrum, that is, by using \(\alpha\), we can reduce the amplitude of the broadband peaks and, in some cases, eliminate them altogether. This by itself, however, is not sufficient because the deep valleys surrounding the peaks still remain in the spectrum. For that reason, spectral flooring is used to “fill in” the spectral valleys and possibly mask the remaining peaks by the neighbouring spectral components of comparable value. The valleys between peaks are no longer deep when \(\beta > 0\) compared to when \(\beta = 0\).
The parameter \(\beta\) controls the amount of remaining residual noise and the amount of perceived musical noise. If the spectral floor parameter \(\beta\) is too large, then the residual noise will be audible but the musical noise will not be perceptible. Conversely, if \(\beta\) is too small, the musical noise will become annoying but the residual noise will be markedly reduced.
The parameter \(\alpha\) affects the amount of speech spectral distortion caused by the subtraction. If \(\alpha\) is too large, then the resulting signal will be severely distorted to the point that intelligibility may suffer.
\[\alpha = \alpha_0 - \frac{3}{20} \textit{SNR} : \text{ for} -5 \leq \textit{SNR} \leq -20\]where \(\alpha_0\) is the desired value of \(\alpha\) at 0 dB SNR and the \(\textit{SNR}\) is the short term SNR estimated at each frame.
The Kalman filter is a general recursive state estimation technique which is modified to work on the speech denoising problem.
Intelligibility Metrics
Along with techniques for speech enhancement, it is important to quantify the degree of enhancement which our methods provide. For this, we tested several metrics as discussed below-
Perceptual Evaluation of Speech Quality (PESQ) is a full-reference algorithm and analyzes the speech signal sample-by-sample after a temporal alignment of corresponding excerpts of reference and test signal. PESQ results essentially model mean opinion score (MOS) that cover a scale from 1 (bad) to 5 (excellent).
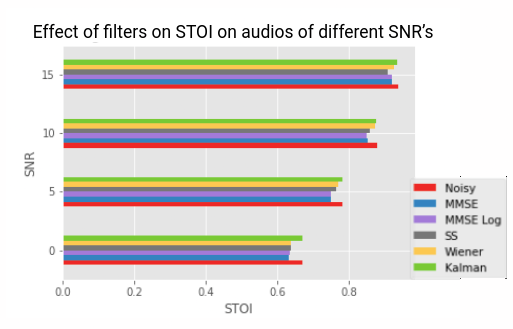
Short-Time Objective Intelligibility (STOI) is an objective metric showing high correlation (\(\rho=0.95\)) with the intelligibility of both noisy, and TF-weighted noisy speech.
Gross Pitch Error (GPE) is the proportion of frames, considered voiced by both pitch tracker and ground truth, for which the relative pitch error is higher than a certain threshold, which is usually set to 20%.
Voicing Error Decision (VED) is the proportion of frames for which an incorrect voiced/unvoiced decision is made.
F0 Frame Error (FFE) is the proportion of frames for which an error (either according to the GPE or the VDE criterion) is made. FFE can be seen as a single measure for assessing the overall performance of a pitch tracker.
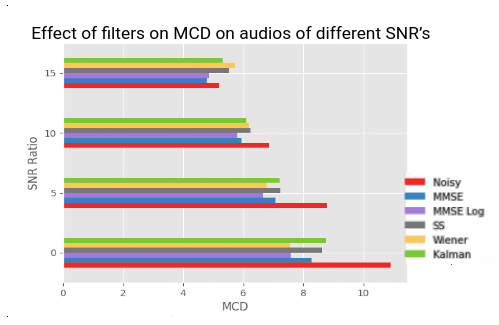
Mel Cepstral Distortion (MCD) is a measure of how different two sequences of mel cepstra are. It is used in assessing the quality of parametric speech synthesis systems, including statistical parametric speech synthesis systems, the idea being that the smaller the MCD between synthesized and natural mel cepstral sequences, the closer the synthetic speech is to reproducing natural speech.
Results
We apply our methods on 2 different datasets: First on the public NOIZEUS dataset and next on a dataset created by the in-house TTS systems of Skit. The results are quite satisfactory when we apply our methods on the NOIZEUS dataset and we found that the Wiener Filter and the Kalman Filters perform the best outperforming one another for different signal-to-noise ratios (SNR).
Conclusion
However they do not perform as well as we want on the TTS dataset. In fact, we observe that our models adversely affecting the input speech. There can be various reasons attributed to this, the primary one being that speech denoising of real life data and TTS Systems are quite different, since both have different noise types. Real life noise is either additive and can be subtracted by noise estimation or can be decomposed as a direct sum of a clean subspace and a pure noise subspace. But the noise in TTS systems are much more subtle and the noise cannot be modelled to be simply additive. Here the noise is generated along with the speech. Hence most of the traditional filters which although work well for real life noise separation, do not work well for this use case. This is where we planned to resort to deep learning models like the Facebook denoiser and SeGAN.
Code
You can find more information on the Github Repository.
References
- Berouti’s Spectral Subtraction
- Kalman Filter for Speech Enhancement
- Speech Enhancement by Philipos C. Loizou
- A comparative study of pitch extraction algorithms on a large variety of singing sounds, PESQ
Author: Ananyapam De, a final year student at IISER Kolkata, majoring in Statistics, while minoring in the Computational Sciences.